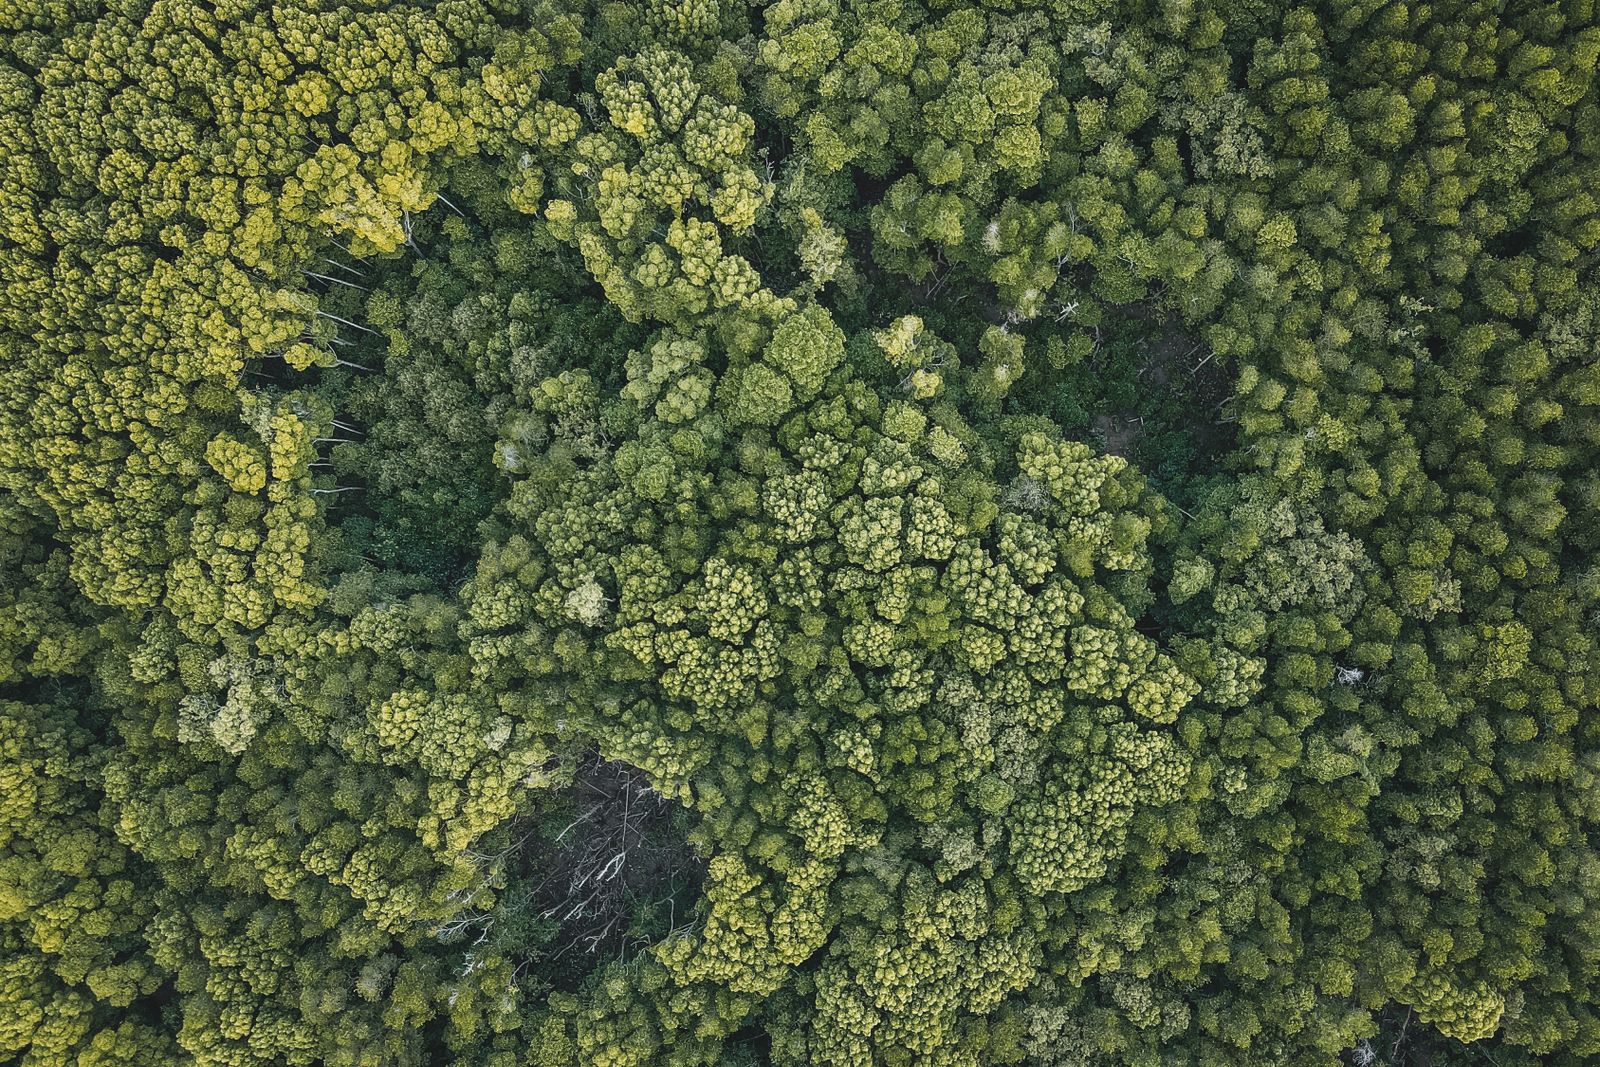
Client story · Environmental Non-profit
Twenty hours of data work a week, down to five minutes
A pipeline that pulls in volunteer-entered lake readings, cleans them and publishes the charts and maps on its own. A model handles the messy human entries that ordinary tools cannot.
- 5 min a weekdown from more than 20 hours
- 21 lakeson one automated pipeline
- Every charttraceable to a reading
The situation
A water-quality non-profit monitoring 21 lakes spent more than twenty hours every week gathering readings, cleaning them and making charts by hand. The data was typed in by volunteers, so it was full of small inconsistencies that broke every normal tool.
What we built
A system that collects the data on its own schedule, cleans it and produces the charts and maps automatically. A model does the one thing rules cannot: make sense of the messy human entries. Everything else is deterministic, so every published number can be traced back to a reading.
Client stories are described at industry level and simplified on purpose. Ask us for a demonstration of the system itself.
More client stories

Industrial & Scientific Distribution
The right box for every shipment
A tablet app on the packing bench that tells each worker which boxes to use for an order. It replaced guesswork that lived in a few heads, and it has run every day since.
Read the story
Industrial & Scientific Distribution
Five thousand qualified leads, researched by a system
A platform that finds potential customers, researches each one, ranks them by fit and drops them into the sales team's own CRM with the useful details already filled in.
Read the story
Logistics & Transportation
Carrier onboarding without the chasing
An onboarding desk that sends the packet, reads what comes back, chases what is missing and verifies insurance evidence at its source. A person still makes the final call.
Read the storyHave a workflow like this one?
We will show you this system running before we scope yours.